Return to P&As Outcome Data Tables report list
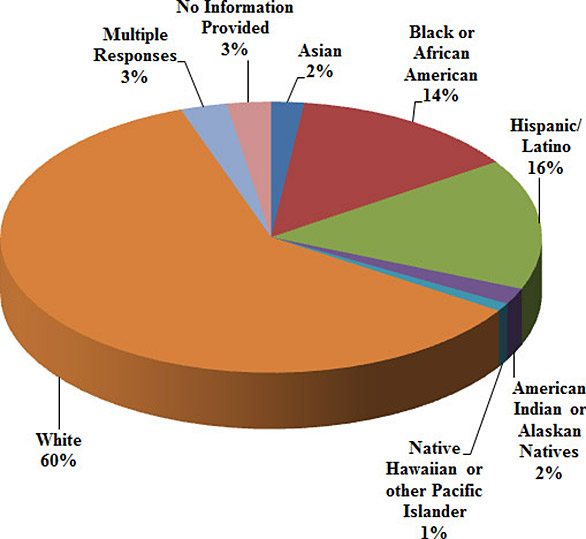
Clients by Racial/Ethnic Background*
Download the Clients by Racial/Ethnic Background data (XLSX, 30.2KB)

| P&A | Asian | Black or African American | Hispanic/ Latino |
American Indian or Alaskan Natives | Native Hawaiian or other Pacific Islander | White | Multiple Responses | No Information Provided | Total |
|---|---|---|---|---|---|---|---|---|---|
| Alaska | 1 | 5 | 3 | 26 | 0 | 48 | 2 | 3 | 88 |
| Alabama | 1 | 74 | 0 | 1 | 0 | 181 | 0 | 0 | 257 |
| Arkansas | 1 | 18 | 1 | 3 | 0 | 43 | 0 | 1 | 67 |
| American Samoa | 0 | 0 | 0 | 0 | 37 | 0 | 2 | 1 | 40 |
| Arizona | 7 | 44 | 206 | 15 | 4 | 409 | 14 | 0 | 699 |
| California | 69 | 99 | 223 | 13 | 8 | 430 | 76 | 7 | 925 |
| Colorado | 0 | 6 | 9 | 0 | 0 | 91 | 0 | 3 | 109 |
| Connecticut | 0 | 5 | 3 | 0 | 0 | 30 | 0 | 0 | 38 |
| District of Columbia | 0 | 56 | 4 | 0 | 0 | 12 | 0 | 0 | 72 |
| Delaware | 0 | 79 | 17 | 0 | 0 | 135 | 3 | 0 | 234 |
| Florida | 14 | 88 | 72 | 1 | 0 | 301 | 15 | 6 | 497 |
| Georgia | 1 | 123 | 6 | 0 | 0 | 160 | 5 | 0 | 295 |
| Guam | 22 | 1 | 2 | 0 | 23 | 3 | 2 | 5 | 58 |
| Hawaii | 42 | 7 | 4 | 0 | 16 | 69 | 142 | 0 | 280 |
| Iowa | 0 | 0 | 2 | 0 | 0 | 75 | 4 | 3 | 84 |
| Idaho | 0 | 2 | 5 | 1 | 0 | 101 | 1 | 1 | 111 |
| Illinois | 10 | 195 | 114 | 2 | 1 | 405 | 43 | 75 | 845 |
| Indiana | 0 | 21 | 3 | 0 | 0 | 88 | 0 | 0 | 112 |
| Kansas | 3 | 23 | 10 | 2 | 1 | 206 | 7 | 14 | 266 |
| Kentucky | 1 | 24 | 8 | 1 | 0 | 250 | 0 | 0 | 284 |
| Louisiana | 0 | 72 | 2 | 1 | 0 | 130 | 3 | 2 | 210 |
| Massachusetts | 9 | 22 | 19 | 1 | 1 | 114 | 0 | 0 | 166 |
| Maryland | 1 | 89 | 13 | 0 | 1 | 154 | 6 | 1 | 265 |
| Maine | 0 | 7 | 5 | 3 | 0 | 234 | 0 | 0 | 249 |
| Michigan | 0 | 80 | 5 | 4 | 0 | 199 | 5 | 4 | 297 |
| Minnesota | 11 | 54 | 11 | 19 | 0 | 362 | 12 | 16 | 485 |
| Missouri | 3 | 58 | 5 | 1 | 0 | 224 | 8 | 0 | 299 |
| Federated States of Micronesia |
26 | 0 | 0 | 0 | 66 | 2 | 0 | 0 | 94 |
| Mississippi | 1 | 73 | 0 | 0 | 0 | 108 | 1 | 1 | 184 |
| Montana | 1 | 0 | 1 | 7 | 0 | 53 | 0 | 1 | 63 |
| Native American P&A |
0 | 0 | 0 | 42 | 0 | 0 | 0 | 0 | 42 |
| North Carolina | 3 | 36 | 4 | 1 | 0 | 146 | 0 | 0 | 190 |
| North Dakota | 4 | 7 | 5 | 56 | 1 | 436 | 0 | 10 | 519 |
| Nebraska | 0 | 1 | 1 | 2 | 0 | 36 | 0 | 1 | 41 |
| New Hampshire | 6 | 10 | 7 | 0 | 0 | 281 | 2 | 8 | 314 |
| New Jersey | 12 | 103 | 60 | 0 | 0 | 428 | 21 | 19 | 643 |
| New Mexico | 0 | 3 | 47 | 2 | 0 | 47 | 0 | 0 | 99 |
| Nevada | 4 | 6 | 26 | 1 | 2 | 73 | 4 | 2 | 118 |
| New York | 29 | 188 | 127 | 6 | 4 | 667 | 12 | 85 | 1,118 |
| Ohio | 10 | 142 | 5 | 2 | 1 | 690 | 25 | 89 | 964 |
| Oklahoma | 6 | 95 | 27 | 86 | 0 | 611 | 24 | 0 | 849 |
| Oregon | 8 | 3 | 17 | 1 | 0 | 90 | 0 | 5 | 124 |
| Pennsylvania | 9 | 200 | 41 | 6 | 2 | 705 | 10 | 50 | 1,023 |
| Puerto Rico | 0 | 0 | 1,268 | 0 | 0 | 0 | 0 | 0 | 1,268 |
| Rhode Island | 2 | 16 | 19 | 0 | 0 | 228 | 8 | 4 | 277 |
| South Carolina | 0 | 39 | 9 | 0 | 0 | 85 | 3 | 8 | 144 |
| South Dakota | 0 | 5 | 1 | 31 | 0 | 125 | 0 | 0 | 162 |
| Tennessee | 0 | 14 | 2 | 0 | 0 | 67 | 2 | 0 | 85 |
| Texas | 19 | 161 | 361 | 0 | 0 | 522 | 10 | 0 | 1,073 |
| Utah | 1 | 4 | 29 | 1 | 5 | 292 | 1 | 1 | 334 |
| Virginia | 3 | 47 | 2 | 0 | 0 | 126 | 0 | 3 | 181 |
| Virgin Islands | 0 | 33 | 8 | 0 | 0 | 1 | 0 | 0 | 42 |
| Vermont | 1 | 7 | 3 | 1 | 0 | 236 | 0 | 42 | 290 |
| Washington | 8 | 13 | 18 | 7 | 2 | 196 | 17 | 6 | 267 |
| Wisconsin | 6 | 30 | 8 | 6 | 0 | 170 | 17 | 4 | 241 |
| West Virginia | 1 | 6 | 2 | 0 | 0 | 102 | 2 | 0 | 113 |
| Wyoming | 1 | 0 | 1 | 2 | 0 | 58 | 0 | 0 | 62 |
| Total | 357 | 2,494 | 2,851 | 354 | 175 | 11,035 | 509 | 481 | 18,256 |
| Pct. | 2% | 14% | 16% | 2% | 1% | 60% | 3% | 3% | 100% |
Notes: Data source: P&A FY 2012 Program Performance Reports. AIDD does not collect P&A clients’ names or other privacy-related data. Each P&A reports their aggregated data to AIDD.
*For the purposes of the PPR (but not necessarily for determining a client-attorney relationship), an Individual client is an individual or group of individuals who meets three criteria: he/she is eligible for a specific P&A program; a file/service record has been opened which includes at least the name, address, age, race, disability, signed release of information form (if appropriate), the concern or complaint and the goal of the action to be taken; and he/she has been provided at least one significant service.

