
Return to P&As Outcome Data Tables report list
Clients by Racial/Ethnic Background
Download the Clients by Racial/Ethnic Background data (XLSX, 21.6KB)
| P&A | Asian | Black or African American | Hispanic/ Latino |
American Indian or Alaskan Natives | Native Hawaiian or other Pacific Islander | White | Multiple Responses | No Information Provided | Total |
|---|---|---|---|---|---|---|---|---|---|
| Alaska | 2 | 4 | 2 | 34 | 3 | 51 | 3 | 1 | 100 |
| Alabama | 2 | 79 | 2 | 0 | 0 | 174 | 0 | 2 | 259 |
| Arkansas | 0 | 31 | 2 | 0 | 0 | 63 | 0 | 1 | 97 |
| American Samoa |
0 | 0 | 0 | 0 | 18 | 1 | 0 | 0 | 19 |
| Arizona | 4 | 45 | 138 | 18 | 2 | 379 | 29 | 0 | 615 |
| California | 72 | 111 | 266 | 7 | 11 | 413 | 62 | 10 | 952 |
| Colorado | 3 | 4 | 8 | 0 | 0 | 68 | 0 | 34 | 117 |
| Connecticut | 1 | 7 | 8 | 0 | 0 | 48 | 0 | 1 | 65 |
| District of Columbia | 0 | 58 | 0 | 1 | 0 | 6 | 0 | 1 | 66 |
| Delaware | 0 | 63 | 13 | 0 | 0 | 103 | 2 | 0 | 181 |
| Florida | 14 | 78 | 70 | 2 | 1 | 306 | 7 | 9 | 487 |
| Georgia | 4 | 124 | 5 | 1 | 0 | 180 | 2 | 0 | 316 |
| Guam | 17 | 0 | 1 | 0 | 44 | 5 | 0 | 2 | 69 |
| Hawaii | 53 | 6 | 10 | 0 | 23 | 82 | 153 | 0 | 327 |
| Iowa | 0 | 0 | 3 | 0 | 0 | 40 | 3 | 1 | 47 |
| Idaho | 0 | 2 | 7 | 1 | 0 | 92 | 0 | 0 | 102 |
| Illinois | 14 | 193 | 146 | 3 | 0 | 382 | 48 | 22 | 808 |
| Indiana | 2 | 17 | 3 | 0 | 0 | 124 | 1 | 1 | 148 |
| Kansas | 2 | 20 | 14 | 2 | 0 | 203 | 4 | 6 | 251 |
| Kentucky | 1 | 27 | 6 | 1 | 0 | 215 | 2 | 0 | 252 |
| Louisiana | 0 | 64 | 4 | 1 | 0 | 99 | 1 | 6 | 175 |
| Massachusetts | 5 | 13 | 18 | 1 | 0 | 84 | 0 | 0 | 121 |
| Maryland | 3 | 74 | 8 | 0 | 0 | 141 | 6 | 0 | 232 |
| Maine | 1 | 7 | 3 | 4 | 0 | 496 | 6 | 23 | 540 |
| Michigan | 1 | 106 | 8 | 4 | 0 | 184 | 5 | 15 | 323 |
| Minnesota | 12 | 57 | 15 | 15 | 0 | 395 | 0 | 27 | 521 |
| Missouri | 4 | 46 | 6 | 1 | 0 | 218 | 9 | 0 | 284 |
| Federated States of Micronesia |
28 | 1 | 0 | 0 | 57 | 1 | 0 | 0 | 87 |
| Mississippi | 1 | 76 | 1 | 0 | 0 | 100 | 2 | 0 | 180 |
| Montana | 0 | 0 | 0 | 8 | 0 | 60 | 0 | 1 | 69 |
| Native American P&A |
0 | 0 | 0 | 43 | 0 | 1 | 0 | 0 | 44 |
| North Carolina | 2 | 54 | 1 | 4 | 1 | 156 | 5 | 2 | 225 |
| North Dakota | 1 | 9 | 8 | 56 | 1 | 412 | 2 | 19 | 508 |
| Nebraska | 0 | 1 | 2 | 1 | 0 | 42 | 0 | 0 | 46 |
| New Hampshire | 2 | 7 | 6 | 5 | 0 | 363 | 2 | 6 | 391 |
| New Jersey | 13 | 99 | 69 | 0 | 0 | 393 | 17 | 10 | 601 |
| New Mexico | 1 | 2 | 67 | 3 | 0 | 52 | 0 | 0 | 125 |
| Nevada | 0 | 8 | 30 | 3 | 0 | 48 | 3 | 1 | 93 |
| New York | 36 | 317 | 291 | 11 | 0 | 1,096 | 89 | 37 | 1,877 |
| Ohio | 7 | 97 | 8 | 0 | 0 | 561 | 11 | 91 | 775 |
| Oklahoma | 1 | 93 | 29 | 71 | 0 | 592 | 53 | 0 | 839 |
| Oregon | 1 | 5 | 10 | 1 | 0 | 70 | 1 | 42 | 130 |
| Pennsylvania | 2 | 185 | 44 | 4 | 0 | 729 | 12 | 0 | 976 |
| Puerto Rico | 0 | 0 | 1,391 | 0 | 0 | 0 | 0 | 0 | 1,391 |
| Rhode Island | 2 | 16 | 23 | 0 | 0 | 208 | 4 | 16 | 269 |
| South Carolina | 0 | 35 | 6 | 0 | 0 | 78 | 0 | 0 | 119 |
| South Dakota | 0 | 5 | 2 | 36 | 4 | 125 | 0 | 0 | 172 |
| Tennessee | 0 | 16 | 4 | 0 | 0 | 58 | 4 | 0 | 82 |
| Texas | 25 | 193 | 398 | 0 | 0 | 551 | 10 | 8 | 1,185 |
| Utah | 1 | 2 | 22 | 2 | 0 | 301 | 1 | 3 | 332 |
| Virginia | 3 | 47 | 1 | 0 | 1 | 112 | 7 | 4 | 175 |
| Virgin Islands | 0 | 49 | 9 | 0 | 0 | 2 | 2 | 1 | 63 |
| Vermont | 2 | 17 | 2 | 1 | 1 | 230 | 5 | 49 | 307 |
| Washington | 6 | 18 | 15 | 7 | 1 | 168 | 16 | 20 | 251 |
| Wisconsin | 3 | 23 | 6 | 9 | 0 | 143 | 9 | 5 | 198 |
| West Virginia | 0 | 1 | 2 | 0 | 0 | 51 | 1 | 0 | 55 |
| Wyoming | 2 | 1 | 2 | 3 | 0 | 75 | 0 | 0 | 83 |
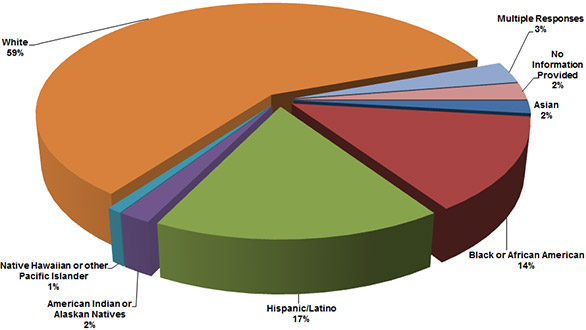
| Total | 356 | 2,613 | 3,215 | 364 | 168 | 11,330 | 599 | 477 | 19,122 |
| Pct. FY 2013 | 2% | 14% | 17% | 2% | 1% | 59% | 3% | 2% | 100% |