
Return to P&As Outcome Data Tables report list
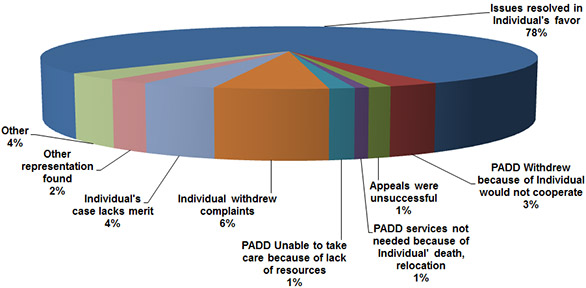
Reasons for Closing Client Case Files
Download the Problem Areas/Complaints of Clients Served data (XLSX, 21KB)
| P&A | Issues Resolved in Individual’s Favor |
PADD Withdrew, Individual Not Cooperative |
Appeals Unsuccessful |
PADD Services Not Needed Due to Death, Relocation |
PADD Unable to Take Care Due to Lack of Resources |
Individual Withdrew Complaints |
Individual’s Case Lacks Merit |
Other Representation Found |
Other | Total |
|---|---|---|---|---|---|---|---|---|---|---|
| Alaska | 39 | 4 | 1 | 2 | 0 | 6 | 5 | 1 | 0 | 58 |
| Alabama | 120 | 1 | 4 | 0 | 0 | 11 | 7 | 1 | 0 | 144 |
| Arkansas | 48 | 3 | 1 | 2 | 1 | 5 | 7 | 4 | 7 | 78 |
| American Samoa | 8 | 0 | 0 | 1 | 0 | 0 | 0 | 0 | 0 | 9 |
| Arizona | 567 | 7 | 3 | 1 | 5 | 0 | 2 | 2 | 2 | 589 |
| California | 757 | 11 | 4 | 4 | 33 | 61 | 10 | 24 | 0 | 904 |
| Colorado | 51 | 4 | 4 | 1 | 0 | 13 | 3 | 3 | 2 | 81 |
| Connecticut | 21 | 0 | 0 | 0 | 1 | 2 | 4 | 1 | 0 | 29 |
| District of Columbia |
26 | 5 | 0 | 0 | 0 | 2 | 2 | 0 | 0 | 35 |
| Delaware | 112 | 1 | 17 | 1 | 0 | 10 | 1 | 0 | 0 | 142 |
| Florida | 282 | 1 | 7 | 6 | 0 | 31 | 16 | 8 | 0 | 351 |
| Georgia | 253 | 2 | 1 | 5 | 0 | 1 | 0 | 2 | 0 | 264 |
| Guam | 42 | 1 | 0 | 0 | 0 | 3 | 0 | 1 | 0 | 47 |
| Hawaii | 199 | 22 | 4 | 1 | 0 | 9 | 9 | 4 | 0 | 248 |
| Iowa | 33 | 0 | 0 | 1 | 0 | 6 | 2 | 1 | 0 | 43 |
| Idaho | 81 | 0 | 2 | 1 | 5 | 3 | 11 | 1 | 0 | 104 |
| Illinois | 242 | 100 | 1 | 1 | 53 | 20 | 27 | 12 | 225 | 681 |
| Indiana | 53 | 9 | 0 | 1 | 0 | 7 | 0 | 3 | 9 | 82 |
| Kansas | 117 | 5 | 9 | 1 | 6 | 45 | 32 | 5 | 14 | 234 |
| Kentucky | 100 | 4 | 6 | 7 | 0 | 2 | 6 | 3 | 0 | 128 |
| Louisiana | 82 | 2 | 0 | 5 | 0 | 6 | 7 | 0 | 2 | 104 |
| Massachusetts | 82 | 0 | 0 | 0 | 0 | 10 | 2 | 2 | 3 | 99 |
| Maryland | 114 | 2 | 2 | 0 | 2 | 3 | 15 | 1 | 4 | 143 |
| Maine | 353 | 13 | 8 | 4 | 1 | 14 | 45 | 4 | 18 | 460 |
| Michigan | 99 | 28 | 9 | 3 | 0 | 22 | 36 | 3 | 4 | 204 |
| Minnesota | 315 | 0 | 2 | 1 | 2 | 16 | 7 | 7 | 0 | 350 |
| Missouri | 217 | 6 | 3 | 5 | 0 | 4 | 3 | 1 | 0 | 239 |
| Federated States of Micronesia |
43 | 0 | 3 | 0 | 0 | 0 | 3 | 10 | 10 | 69 |
| Mississippi | 92 | 20 | 3 | 3 | 4 | 10 | 10 | 2 | 0 | 144 |
| Montana | 23 | 0 | 5 | 1 | 1 | 3 | 16 | 2 | 3 | 54 |
| Native American P&A |
13 | 2 | 0 | 0 | 0 | 0 | 1 | 0 | 0 | 16 |
| North Carolina | 151 | 4 | 1 | 9 | 1 | 19 | 0 | 1 | 0 | 186 |
| North Dakota | 553 | 2 | 0 | 1 | 0 | 0 | 0 | 0 | 0 | 556 |
| Nebraska | 12 | 2 | 0 | 0 | 1 | 3 | 0 | 0 | 0 | 18 |
| New Hampshire | 284 | 1 | 0 | 0 | 0 | 11 | 6 | 1 | 0 | 303 |
| New Jersey | 332 | 10 | 0 | 5 | 0 | 20 | 14 | 16 | 0 | 397 |
| New Mexico | 58 | 7 | 0 | 1 | 1 | 7 | 5 | 8 | 2 | 89 |
| Nevada | 66 | 2 | 0 | 0 | 1 | 3 | 1 | 1 | 3 | 77 |
| New York | 1,490 | 5 | 37 | 2 | 6 | 286 | 19 | 3 | 66 | 1,914 |
| Ohio | 583 | 15 | 15 | 1 | 12 | 48 | 44 | 26 | 20 | 764 |
| Oklahoma | 507 | 0 | 0 | 0 | 0 | 0 | 0 | 1 | 0 | 508 |
| Oregon | 57 | 1 | 0 | 0 | 3 | 1 | 1 | 0 | 6 | 69 |
| Pennsylvania | 683 | 17 | 4 | 12 | 3 | 29 | 54 | 155 | 0 | 957 |
| Puerto Rico | 717 | 6 | 3 | 0 | 0 | 0 | 28 | 4 | 0 | 758 |
| Rhode Island | 34 | 4 | 2 | 0 | 6 | 10 | 9 | 4 | 12 | 81 |
| South Carolina | 58 | 3 | 0 | 0 | 0 | 7 | 8 | 0 | 1 | 77 |
| South Dakota | 88 | 15 | 2 | 1 | 0 | 5 | 8 | 2 | 0 | 121 |
| Tennessee | 50 | 9 | 0 | 0 | 0 | 15 | 6 | 2 | 0 | 82 |
| Texas | 631 | 43 | 19 | 9 | 33 | 75 | 52 | 14 | 75 | 951 |
| Utah | 292 | 6 | 0 | 3 | 0 | 7 | 19 | 1 | 0 | 328 |
| Virginia | 99 | 17 | 3 | 9 | 1 | 2 | 15 | 2 | 11 | 159 |
| Virgin Island | 15 | 0 | 0 | 0 | 0 | 11 | 1 | 0 | 2 | 29 |
| Vermont | 121 | 1 | 0 | 1 | 21 | 42 | 41 | 7 | 23 | 257 |
| Washington | 258 | 0 | 0 | 1 | 0 | 0 | 0 | 0 | 1 | 260 |
| Wisconsin | 135 | 4 | 3 | 4 | 2 | 4 | 6 | 4 | 4 | 166 |
| West Virginia | 45 | 0 | 1 | 0 | 5 | 3 | 1 | 0 | 7 | 62 |
| Wyoming | 68 | 0 | 0 | 1 | 0 | 1 | 0 | 0 | 0 | 70 |
| Total | 11,971 | 427 | 189 | 118 | 210 | 934 | 627 | 360 | 536 | 15,372 |
| Pct. FY 2013 | 78% | 3% | 1% | 1% | 1% | 6% | 4% | 2% | 3% | 100% |